December marked the end of the first year of our Senti-Bot tool’s presence in the cryptocurrency market. In December alone, the bot’s net profit increased by 16 percentage points compared to November, allowing us to end the entire year of 2023 with a return (net) of 155%. We would like to emphasize that these impressive results were achieved thanks to Senti-Bot, using the proprietary CryptoPulse BTCUSDT strategy. Our tool not only combined efficiency in achieving profits, but also provided maximum risk protection.
Table of Contents
Senti-Bot results
In order to objectively compare the performance of Senti-Bot – in the Bitcoin market – to other tools offered, as well as other financial instruments, to begin with, we present its results in gross terms (not including the cost of commissions charged by the exchange – in our case Binance), against a typical hodl.
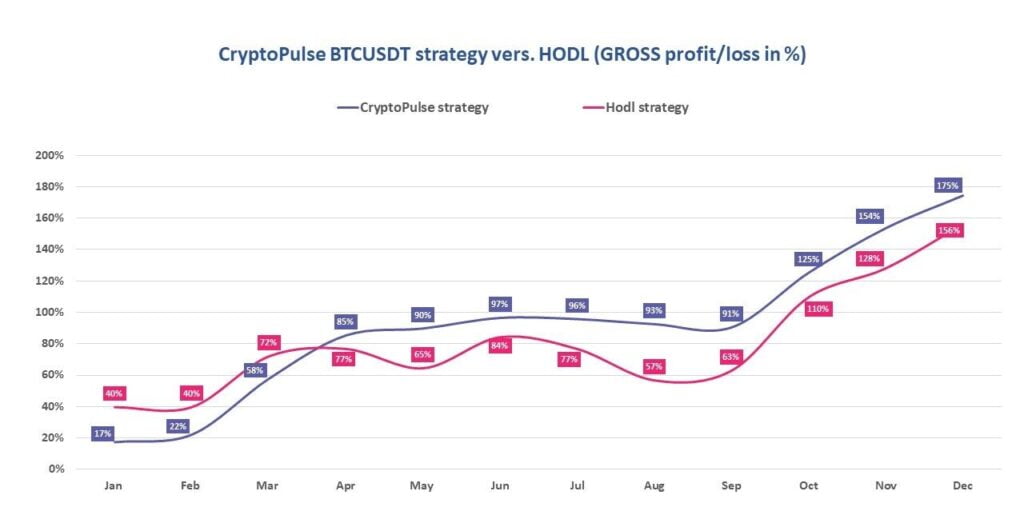
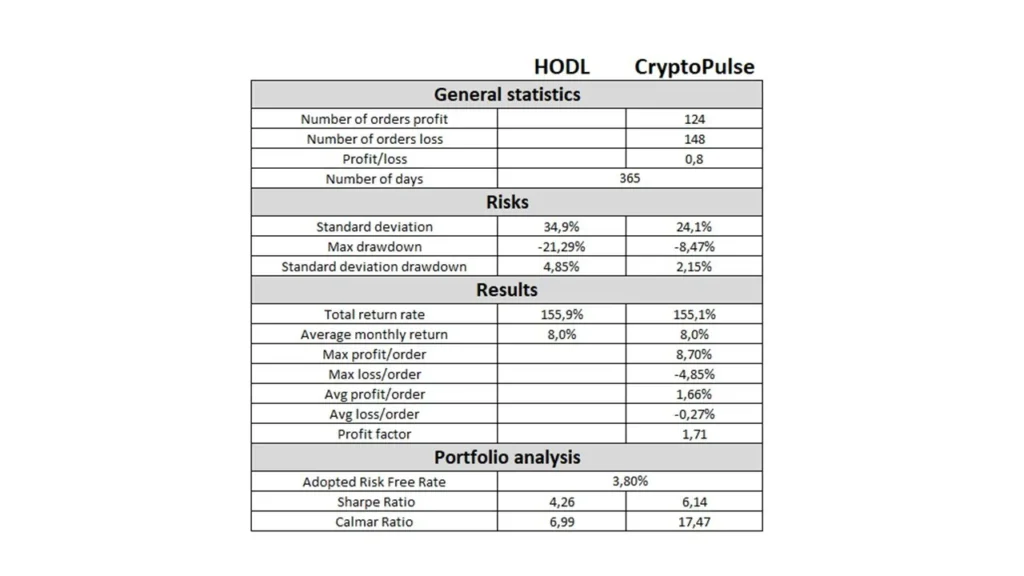
As can be seen, the gross ROI (Return on Investment) reached 175% for the year. In contrast, the net return on investment ROI was 155% (after taking into account transaction fees charged by the stock exchange).

Senti-Bot’s monthly performance varied in 2023. The chart below shows the month-to-month changes in net result. It is worth noting that 2023 was a period of significant fluctuations in the Bitcoin exchange rate. These fluctuations also affected the profitability of our tool, but most importantly confirmed its effectiveness in achieving its main goals:
- in the first place to protect your capital from losses resulting from spikes in the BTC exchange rate;
- in the second place, to generate profits from the operations carried out.
Confirmation of Senti-Bot’s efficiency is provided by data on the level of maximum drawdown, which:
- for our tool in 2023 was -8.5%,
- in comparison, the drawdown for Bitcoin investments (hodl) was -21.3%.
Further confirmation of effectiveness is provided by statistics on the number of closed positions with a profit and loss greater than 1.5%:
- number of positions closed with a profit greater than 1.5% = 43; that is, 34.7% of all positions closed with a profit,
- number of positions closed with a loss greater than -1.5% = 16; that is, 10.8% of all positions closed with a loss.
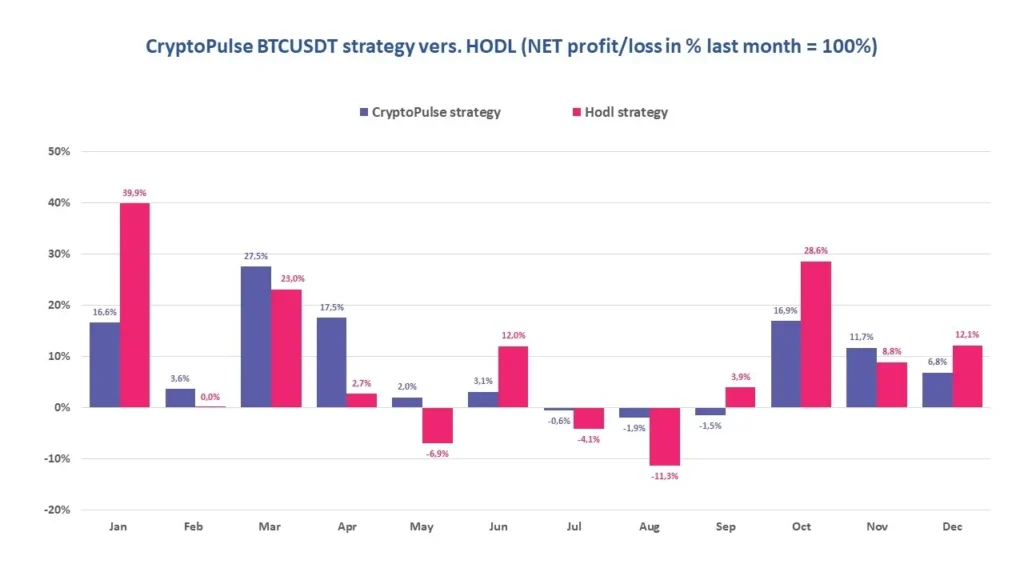
An analysis of Sent-Bot’s monthly results further shows that even when the bot was recording losses – they were seven times lower than when it was hawking cryptocurrency.
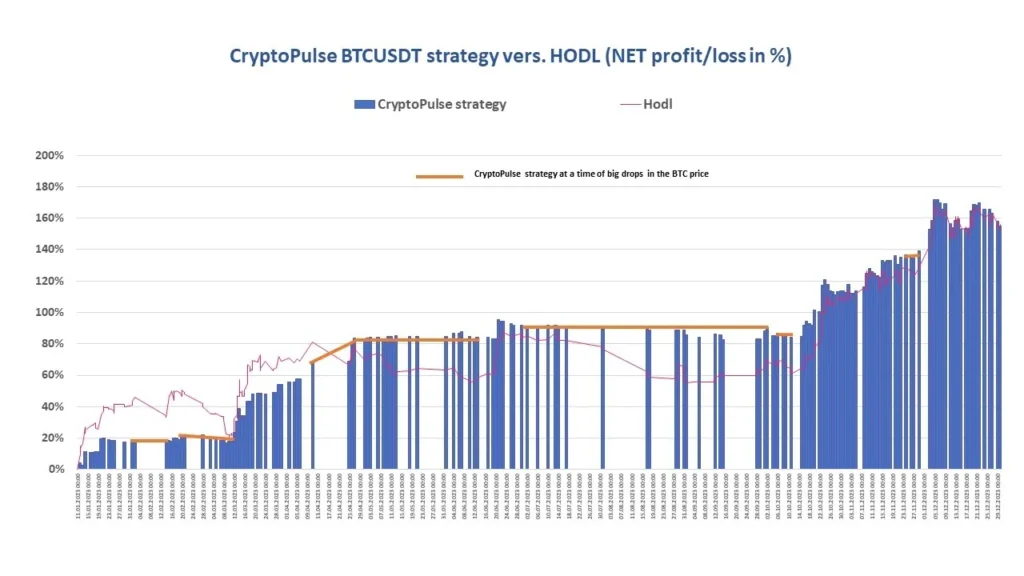
The chart presented here illustrates (in orange) how effectively Senti-Bot has hedged your capital in the BTC market, while allowing you to generate profits. Between January and December, we experienced several prolonged periods during which there were significant declines in the price of the cryptocurrency.
Senti-Bot’s efficiency is mainly due to the fact that it mostly closes long positions before anticipated declines in the BTC price. This situation is confirmed by the average values of closed profits (avg profit/order) and losses (avg loss/order):
- avg profit/order = +1.66%,
- avg loss/order = -0.27%
Senti-Bot performance indicators
We emphasize that the effectiveness of Senti-Bot should be considered over a period of more than one or two months.
Important elements of assessing the effectiveness of our tool are measurements of such indicators as:
- Drawndown
- Profit factor
- Sharpe Ratio
- Calmar Ratio
Drawdown
Drawdown is simply the largest percentage reduction in the value of capital from its highest level. It is calculated by comparing the highest capital level to date with its current value.
The maximum drawdown (in the January-December period) for the CryptoPulse BTCUSDT strategy was -8.47%, while in breeding it was as high as -21.29%.
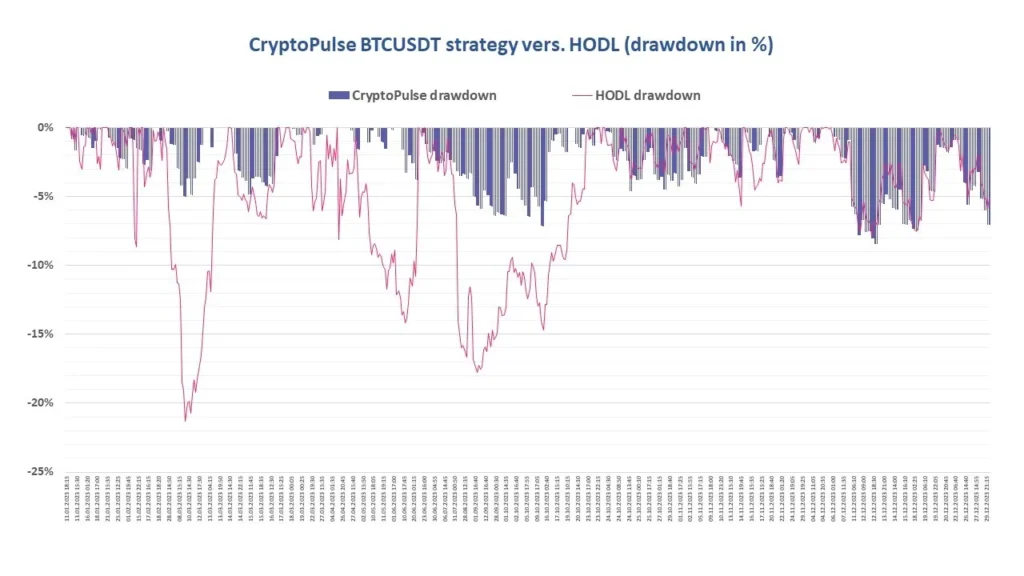
It is worth highlighting one more important piece of information regarding significant capital drawdowns throughout the year. In our analysis, we adopted the level of -5% as the limit for a significant drawdown. Taking this into account, in the case of breeding, we recorded 8 capital declines exceeding the adopted level (their values are: -8,6%; -21,3%; -6,6%; -6,1%; -14,17%; -17,77%; -5,68%; -7,87%).
In contrast, Senti-Bot, operating for you on the basis of the CryptoPulse BTCUSDT strategy, recorded only 3 such declines, and their values were considerably lower than the breeding (-5.0%; -7.2%; -8.5%).
Profit Factor
Another measure worthy of attention is the profit factor. This ratio is defined as the sum of all transactions with a profit, divided by the sum of all transactions closed with a loss. A profit factor above 1.50 is considered good enough, and above 2.0 is considered ideal
The Profit Factor for Senti-Bot was 1.71 at the end of December 2023 (that is, above the level considered good enough).
Sharpe Ratio
In order to assess the ratio of the return achieved to the risk taken, we track two main indicators. The first is the Sharpe ratio, which measures the risk-adjusted return (measured by average deviation). The higher the values of this indicator, the better the investment is considered. Investments for which the Sharpe Ratio is greater than 3.0 are considered among the best.
For Senti-Bot, this ratio was higher than for the vast majority of mutual funds, reaching a very high value of 6.14 at the end of December! It was even better than that for the breeding strategy (4.26).
Calmar Ratio
Calmar Ratio is the second main indicator of investment performance, determining the ratio of the rate of return (calculated on an average annual basis) in relation to the maximum landslide. In general, the higher its value, the better. This is because it signifies by how many times the average annual cumulative rate of return exceeds the slippage to date. Values above 1 mean that the rate of return, was higher than the landslide.
For Senti-Bot, the value of this indicator was 17.47 at the end of December, more than double the landslide.
Summary
We would like to thank all our users for their trust and words of approval. We encourage you to follow the results of Senti-Bot in the next year !
SentiStocks Team
