Since an update to the Sentistock bot was only recently made available, which now makes decisions on Bitcoin much faster than before – every 15 minutes (CryptoPulse strategy), compared to the earlier hourly one (Conservative strategy), it seems an opportune time to compare how the bot would have fared using the above strategies over the course of this year – that is, from January 01 to August 08. Due to the fact that I have owned an active bot from Sentistock since last October and analyze investments on a daily basis, I decided to conduct my own comparative analysis and, via Sentistock, share the results with you.
Investment results
Let’s quickly recap how the bot from Sentistock invests. Based on current emotions read from online mentions of bitcoin from sources such as (Twitter, Reddit, etc.), the learned artificial intelligence makes decisions to buy or sell bitcoin. Until now, the bot decided every hour (Conservative strategy), which changed with an update tested since the beginning of the year (CryptoPulse), which reduced this period to 15 minutes. In both strategies, the bots had only two options to choose from – a long position or no position, which meant that their profits depended solely on an increase in the Bitcoin price. In addition, both bots invested all available capital and did not use leverage.
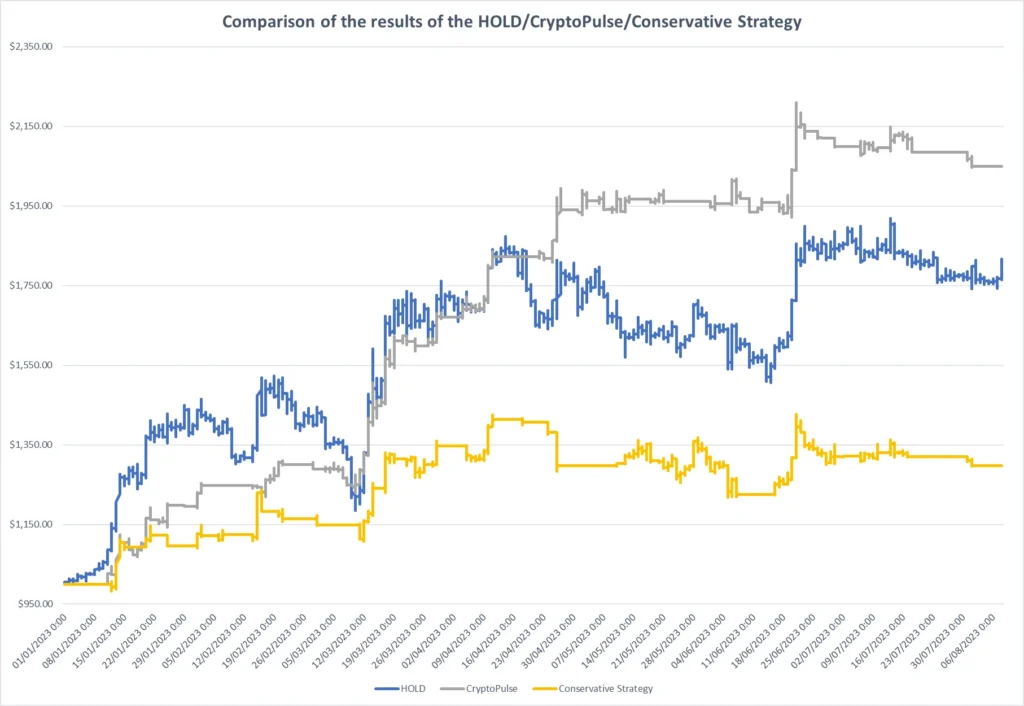
To assess which investment strategy turned out to be the best, we first look at the total return of the investment. Of course, many novice investors would end their analysis at this stage, which is a common mistake, but we will now proceed to address this further. The investment results for two bots that invested an initial US$1,000 earlier this year relative to the purchase of Bitcoin (HOLD) can be seen in Chart 1. Bitcoin is up 80% over this period, where a bot playing on the legacy Conservative strategy has achieved almost 30%. The CryptoPulse strategy, freshly available to investors, achieved a return of 104.9% during this period. Thus, the bot available to investors achieved an inferior rate of return against the so-called benchmark, bitcoin, during this period.

Chart I: Comparison of investment strategies
For those who are interested, I also include in Table I, the overall statistics of the bot’s behavior. It is worth noting that in both strategies the percentage of profitable positions is less than half. Focusing on the highest possible “Win/Lose ratio” is often a mistake when analyzing investment strategies, as in the long term this is not what determines the return on investment.

Table I: General statistics
Investment risk analysis
Underestimating, failing to consider and misjudging risk are some fundamental mistakes investors make. Therefore, let’s take a brief look at how to measure risk in investments and how investment strategies perform in the context of Bitcoin.
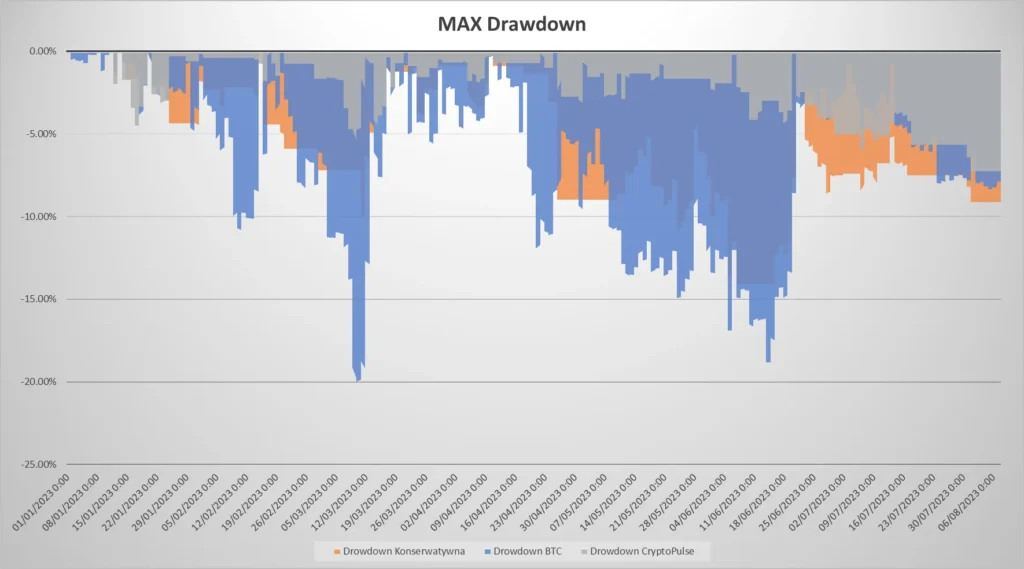
The two primary metrics for measuring risk are the Standard Deviation, which measures the volatility of the price relative to the average value (see Table II), and the Drawdown, which measures the percentage decline from the portfolio’s peak. The full comparative run of Drawdowns can be seen in Chart II.
It turns out that both the Conservative and CryptoPulse strategies, regardless of how the risk is measured, have significantly lower risk levels. This is particularly evident in the case of the maximum portfolio drawdown, which, when the price of Bitcoin fell by more than 20%, was just under 15% for the Conservative strategy and only 7.4% for CryptoPulse. It appears that, over the period studied, both strategies showed significantly less risk, with a decrease in the correlation with the bitcoin price (decrease in correlation).

Table II: Measures of investment risk

Chart II: Drawdown of investment strategies
Portfolio analysis and conclusion
Various indicators are used to assess the effectiveness of different investment strategies, which help to combine, potential returns and risks of investing. One of the most popular of these indicators is the Sharpe ratio.
The Sharpe ratio helps us understand how much above-average return we can expect compared to investing in safe assets such as government bonds (which, in this case, yield around 3.8% per year). That is, the ratio helps us to assess how much return we are getting relative to the risk (measured by standard deviation) we are taking. In other words, the Sharpe ratio allows us to compare whether the risk an investor is taking is worth the potential returns. Sharpe ratio values above 3 are assumed to be considered excellent investments. The Sharpe ratio in the period under review for bitcoin was 3.58, the previous Conservative on Bot strategy proved less effective, for which the Sharpe was 1.95, which is still a decent result. However, the now-introduced CryptoPulse update has improved this score by more than 2 times to 8.86, which we can already compare to the performance among the best mutual funds in the world (see Table III).
Another popular indicator for assessing portfolio performance is the Calmar Ratio. It is similar to the Sharpe ratio, but measures risk as the maximum drawdown of a portfolio, which allows us to assess the ratio of excess gain to maximum risk of loss. The value of this ratio for bitcoin over the period studied was 7.17, for the Conservative strategy it was 3.38, and for the CryptoPulse strategy it was as high as 29.68. As with the Sharpe ratio, this suggests that the CryptoPulse strategy was the most dominant over the period studied, being as much as 4 times more efficient than investing in bitcoin. Given the continued growth of the Sentistock bot, we must note that initially this year, the bot showed lower efficiency compared to the bitcoin buying strategy. Nevertheless, the latest update seems to address the main problem of the earlier version, which was a delayed response to dynamic changes in the cryptocurrency market.

Table III: Comparison of portfolio analysis indicators of investment strategies
About Author
This article is only an analysis carried out by Grzegorz Dróżdż CAI MPW for his research purposes on 17.09.2023. The article does not constitute investment advice nor is it intended to encourage the purchase, sale, or investment in any assets specifically mentioned in it. The author of this article accepts no responsibility for any investment decisions made based on the information contained in the article.
I encourage you to use the information contained in the article for educational and informational purposes only, and to consult an experienced financial advisor before making any investment decisions.
