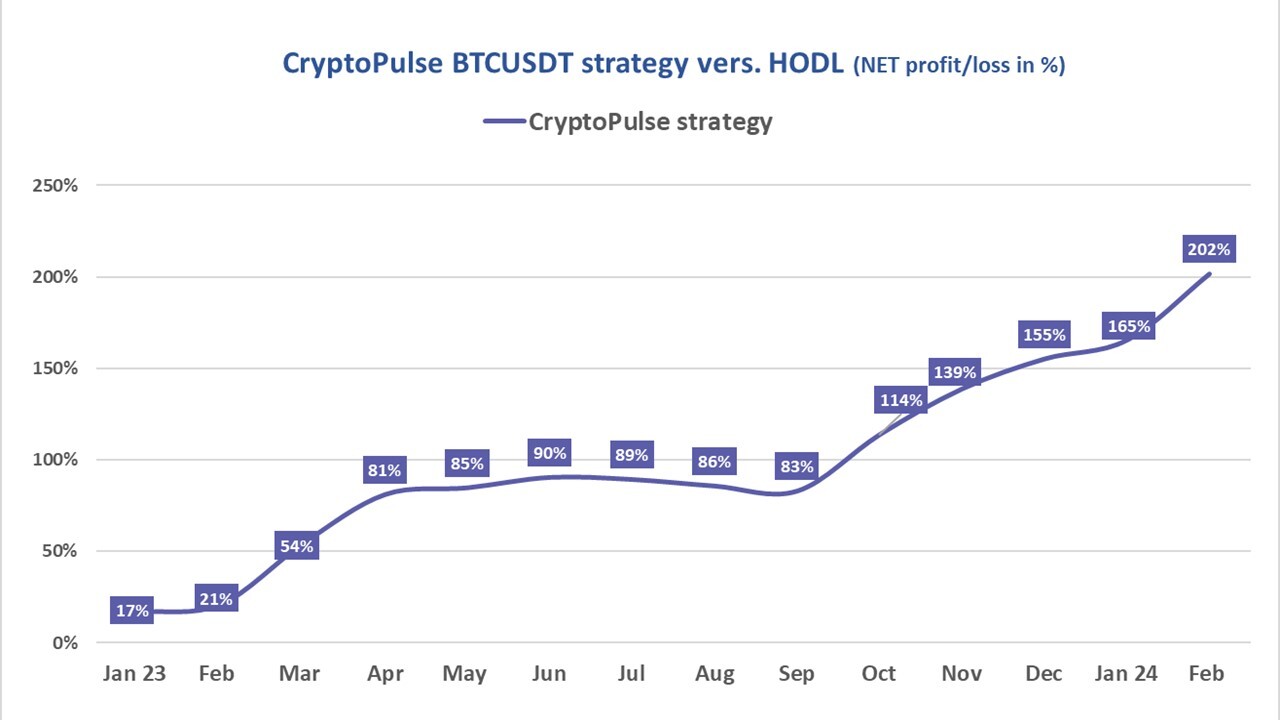
Trying to cash in on market sentiment is the main goal of the Sentistock project. For this reason, we are honored to present Senti-Bot’s results on the cryptocurrency market for February this year. “The results speak for themselves” – this statement best captures the achievements to date, created for you artificial intelligence, which has recorded an impressive 202% growth since the beginning of the previous year.
Table of contents
Video Summary
Senti-Bot results
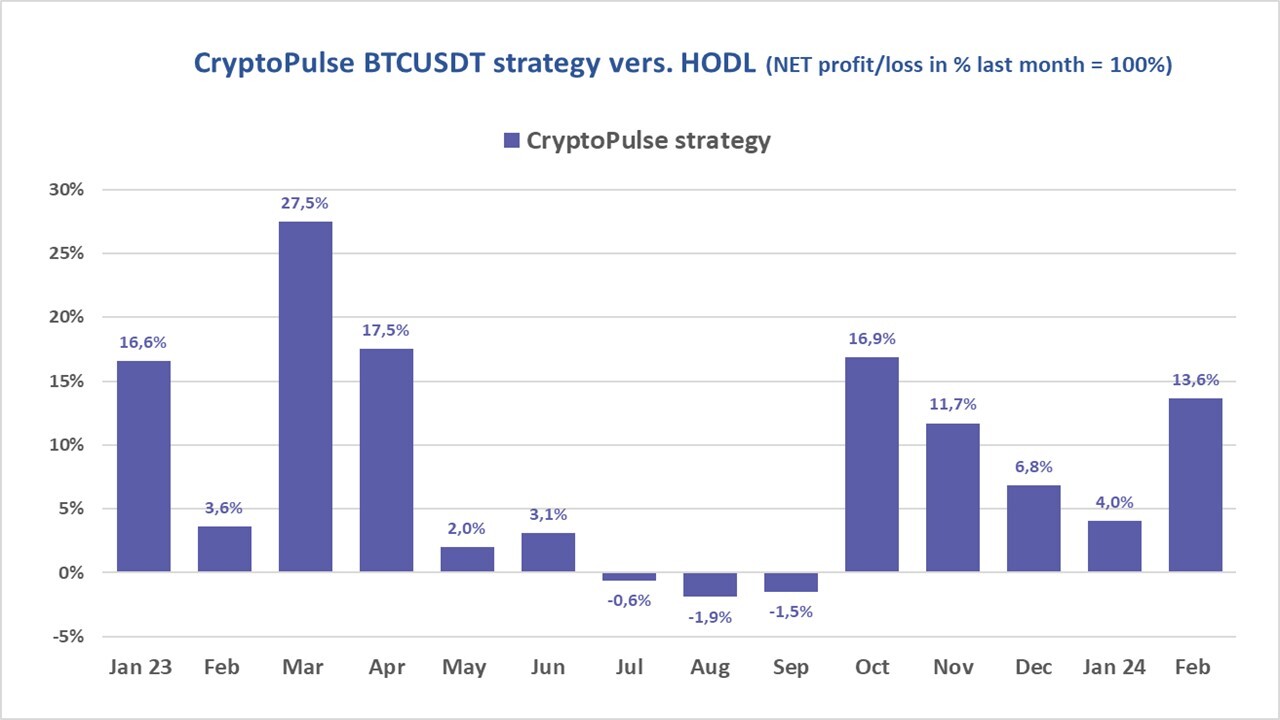
We want to share with you an analysis of Senti-Bot’s effectiveness in the cryptocurrency market compared to other tools available on the market. So we present the gross results (that is, the one that doesn’t include the Binance exchange’s commission costs) so that you can compare exactly how the bot performs compared to other solutions. February proved to be an exceptionally successful month. In this single period, net of costs, Senti-Bot’s net profit reached 13.6%, contributing to a total profit of 202% since the project was made available to you.
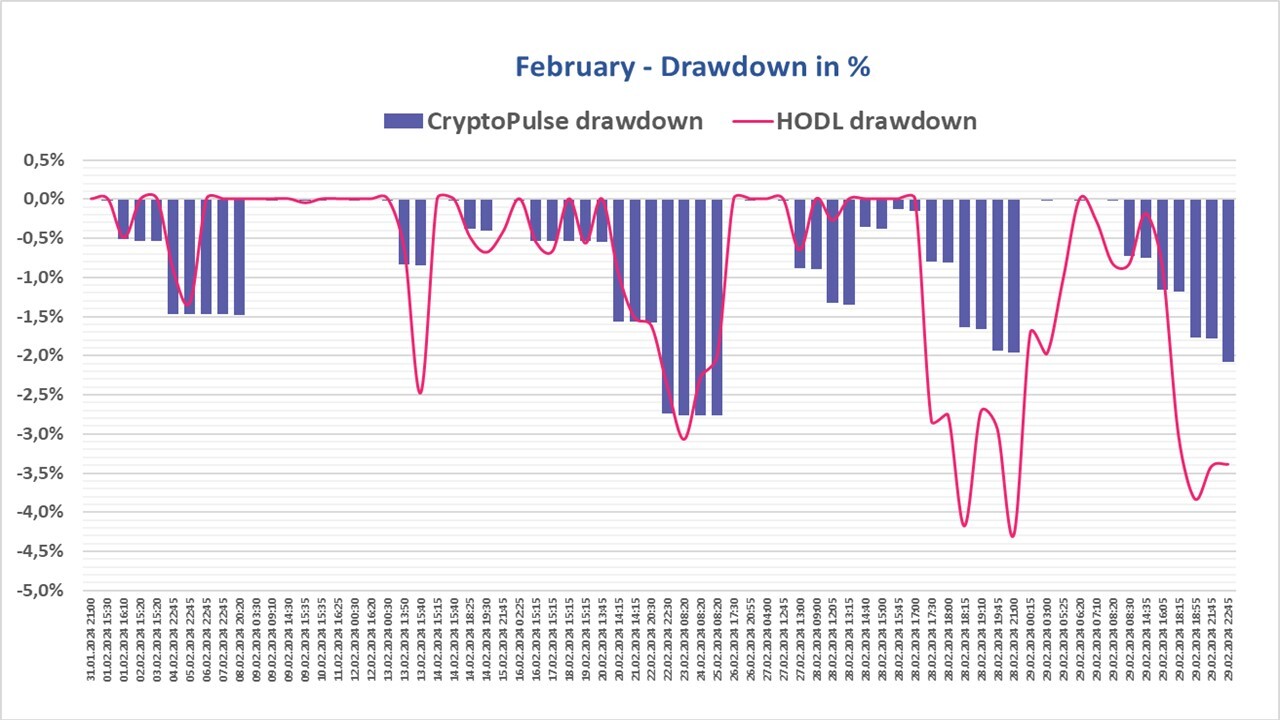
 Apparently, the first rule of “Fight Club” is “don’t waste money”…. At least that’s the principle we have found to be central to Senti-Bot’s operation. Its effectiveness can be seen in the chart below. It presents the maximum decrease in the value of the portfolio, known as the “maximum”. Drawdown, in February, which did not exceed 3%, compared to more than 4% for Bitcoin’s hodling strategy.
 Senti-Bot’s positive performance in February was largely aided by a surge of optimism in the cryptocurrency market, which grew strongly for most of the month. This enabled Senti-Bot to effectively exploit the prevailing conditions. As a result, this was the fifth consecutive month in which Senti-Bot generates a positive result for you, growing at a monthly average of 10.6% during this time.
Senti-Bot achieves its effectiveness mainly by anticipatory exiting positions ahead of anticipated declines in Bitcoin’s price, discernible in emotions analyzed from social media. Proof of the effectiveness of this approach is provided by the average values of transactions ending in profit and loss:
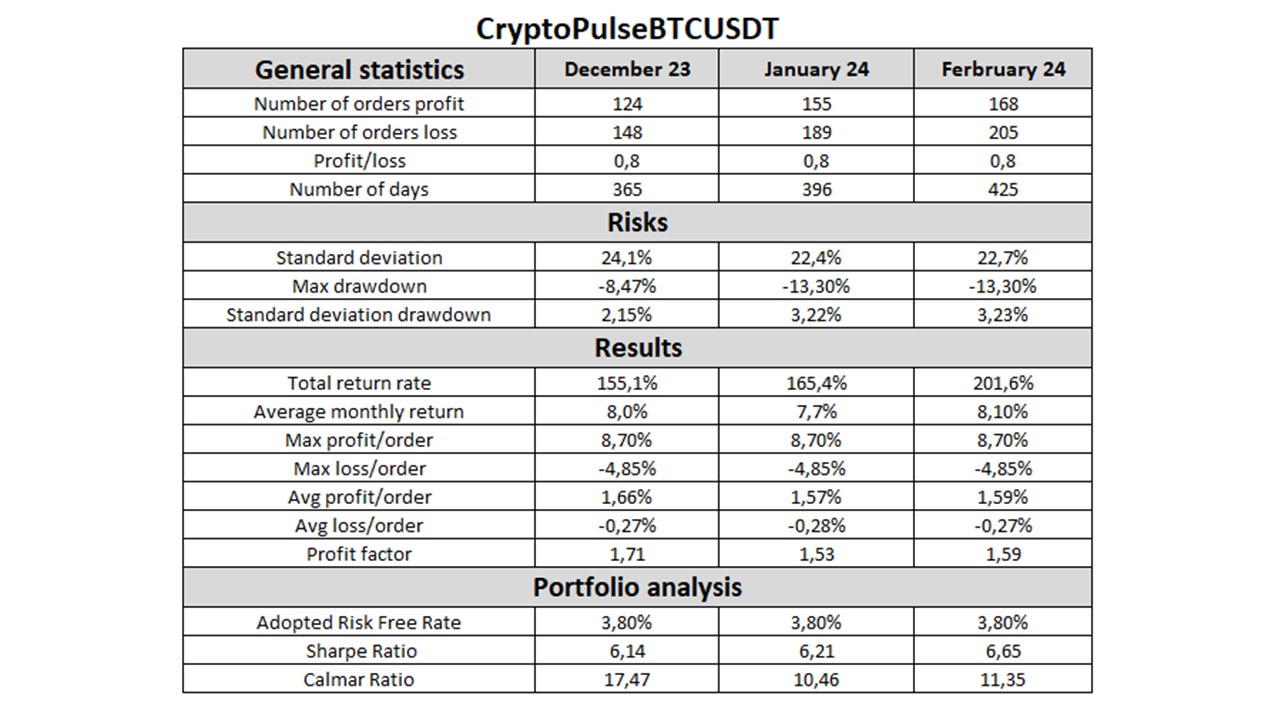
- The average profit per order is: +1,59%,
- The average loss per order is: -0,27%.

Senti-Bot performance indicators
We emphasize that the effectiveness of Senti-Bot should be considered over a period of more than one or two months. Important elements of evaluating the effectiveness of our tool are measurements of such indicators as:- Drawndown
- Profit Factor
- Sharpe ratio
- Calmar indicator
Drawdown
Drawdown is, simply put, the largest percentage reduction in capital value from its highest level. It is calculated by comparing the highest previous capital level with its current value. The maximum drawdown (over the entire period) for the CryptoPulse BTCUSDT strategy was -13.2%, while in the Bitocin hodling it was already -21.3%.
Profit Factor
Another measure that deserves attention is the profit factor. The ratio is defined as the sum of all transactions with a profit divided by the sum of all transactions closed with a loss. A profit factor above 1.50 is considered good enough, and above 2.0 is considered ideal. The Profit Factor for Senti-Bot was 1.59 at the end of February 2024. We can interpret that for each transaction the bot gained 59% more on average than it lost.Sharpe ratio
In order to assess the ratio of the return achieved to the risk taken, we track two main indicators. The first is the Sharpe ratio, which measures risk-adjusted return (measured by average deviation). The higher the values of this indicator, the better the investment is considered. Investments for which the Sharpe Ratio is greater than 3.0 are considered among the best. For Senti-Bot, the Sharpe ratio at the end of February was 6.65, which was significantly higher than for most mutual funds. This is significant because a higher Sharpe ratio means more than 6 times higher returns relative to risk, which confirms the attractiveness of our investment strategy.Calmar indicator
Calmar Ratio is the second main indicator of investment performance, which determines the ratio of the rate of return (calculated on an average annual basis) in relation to the maximum slippage. In general, the higher its value, the better. This is because it means by how many times the average annual cumulative rate of return exceeds the past slide. Values above 1 mean that the rate of return, was higher than the landslide. At the end of February, Senti-Bot’s Calmar index was 11.35, surpassing Bitcoin’s hodling with a score of 9.36. With high profits and a lower drawdown, the bot has provided you with a result of more than 10 times its maximum drawdown.Table – summary summary
 We thank all our users for their trust and words of approval. We encourage you to follow Senti-Bot’s performance in the coming months!
SentiStocks team