How do our predictions for the cryptocurrencies are made? Below we present a schematic description of the model used in the process of forecasting cryptocurrencies trend, from the stage of data collection, through analysis, to the final results.
Cryptocurrency predictions. Data aggregation
Behavioral data (textual mentions)
Text data (mentions) are continuously collected from the most valuable internet sources such as Twitter or Reddit, in terms of content quality and quantity. They are downloaded in English and contain key phrases we have chosen, e.g., : “crypto“. Each mention has its timestamp, which determines when it is written and downloaded.
Financial data
The financial analysis model continuously downloads data via the exchange API *Bitstamp. For comparison purposes, users can download it from sites such as BitStamp (downloadable CSV file) or CoinPaprika (option “export” under the chart).
*Bitstamp has been selected as the source of financial data for its access convenience. In the target solution, it is planned to extend the possibility of picking as a source one of several available stock exchanges.
Analysis. Sentiment and emotions
Behavioral analysis (emotive)
- In the first step, the model continuously evaluates all downloaded mentions regarding the emotions they contain. Per each mention, 11 emotional parameters are assigned – 8 emotions, 2 sentiments – positive and negative, and arousal;
- Then, depending on the criteria set for the predictive data, the results of the emotional evaluation for each mention are grouped (packed) into specific packages. For example, for a 24-hour prediction, it is a one-hour package and for 1-hour prediction – 5 minutes package.
The whole process takes place in a continuous mode where for example, the last 3 days’ mentions are analyzed (every day after 15:00 UTC) for 24-hour prediction. This means that, for the 5th of May 2020, the mentions from May 2nd, 3PM UTC to May 5th, 15:00 UTC are taken for analysis. Analogically in 1-hour predictions for 15:00 UTC on May 5th 2020, mentions from 12:00 UTC to 15:00 UTC are taken for analysis.
Each mention is evaluated as a percentage of 11 emotional markers: 8 emotions, 2 sentiments – positive and negative, and arousal.
Financial analysis
- In the first stage, the model takes the candle data from the stock exchange and then buckets them into packages of equal size, analogically as in the case of social mentions;
- Then new candles are created from the resulting packages. For example, for the 24h prediction, hourly candles are created (for 1-hour prediction – 5 minutes candles), containing the opening price, closing price, high and low.
Cryptocurrency forecast. Predictions results
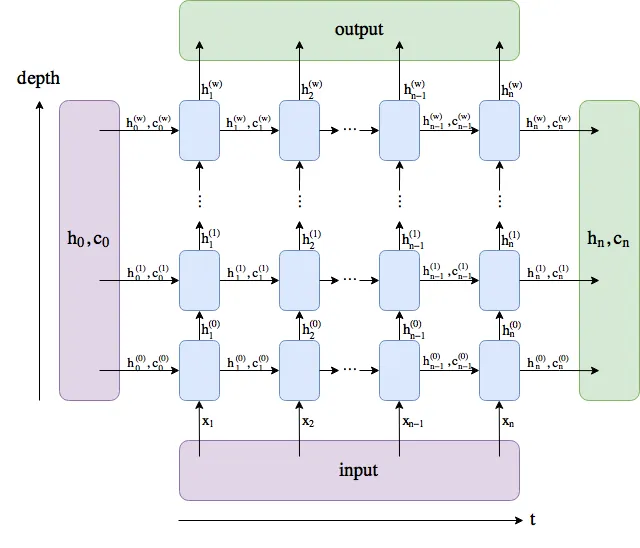
In the final stage, the Sentistocks model compares the received behavioral data packages with the financial data packets, looking for correlations between them. The very way of operation of our model based on deep neural networks – the model for trend prediction in the next time window is built based on an artificial neural network using BiLSTM (bidirectional long short-term memory), which is a recursive neural network dedicated to processing sequential data in both directions.
Here you can find the graphic scheme of how the model works:

LEGEND:
The input of the LSTM Layer:
- Input: In our case, it’s a packed input, but it can also be the original sequence while each Xi represents a word in the sentence (with padding elements).
- h_0: The initial hiLegenda:dden state that we feed with the model.
- c_0: The initial cell state that we feed with the model.
The output of the LSTM Layer:
- Output: The first value returned by LSTM contains all the hidden states throughout the sequence.
- h_n: The second output is the last hidden states of each of the LSTM layers.
- c_n: The third output is the last cell state for each of the LSTM layers.
For example, the set of behavioral input data for the 24-hour average prediction are 72 hourly packages (last 3 days) and the same amount of financial data (72 hourly candles + transaction volume for each hour). Thus, a total of 16 variables are taken for each of the 3 windows: 11 emotional (behavioral) and 5 financial variables.
The final value to which we tune the model during supervised learning is the value of the average closing price in the following 24 hours.
For prediction, we use the model learned on data from the full 2018 and 2019. This amount of information allows us to learn patterns that allow for effective prediction. The model can generate results every hour in the form of the average closing price for the next 24 hours.
