Emotional intensity analysis as an early warning tool in the company. There are many tools for monitoring companies’ economic situation. A number of them are “sensors” for early warning of problems. At the same time, they provide information about phenomena beneficial for companies. In most companies, there is a regular problem of sales decline. The management then looks for the causes that affected this phenomenon. The question is if it could have been foreseen.
ORBIS S.A. in the third quarter of 2018 – example of crisis
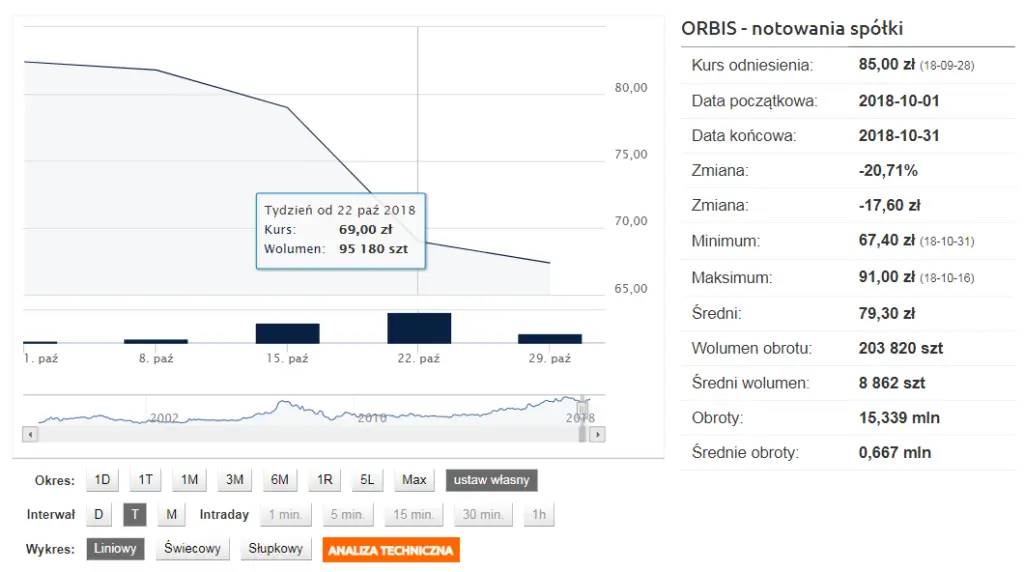
Similar doubts were probably raised by the shareholders and – more likely – the heads of the ORBIS S.A., whilst looking at the financial statements for the third quarter of 2018. For this period, the aforementioned company recorded a decrease in revenue for both in comparison with the second quarter of 2018 and in comparison with the third quarter of 2017. Such a phenomenon appeared for the first time since many years (which pictures the table below).
[table id=1 /]
Revenue of Orbis S.A. Source: own work based on Bankier.pl
Probably, it was already during the third quarter of 2018. A number of indicators used internally by the company signalled a possible problem of a sales drop, yet in this area there certainly was no analysis of changes in the intensity of emotions in texts published in the press or social media about ORBIS S.A. In other words, there was no analysis of emotions that the recipients – i.e. customers – evoke even seemingly neutral references to the company.
Emotional intensity. Emotions towards Orbis and the financial crisis
Even a simple sentiment analysis of this period shows there was a substantial decrease in positive feelings among the recipients of texts about ORBIS S.A.
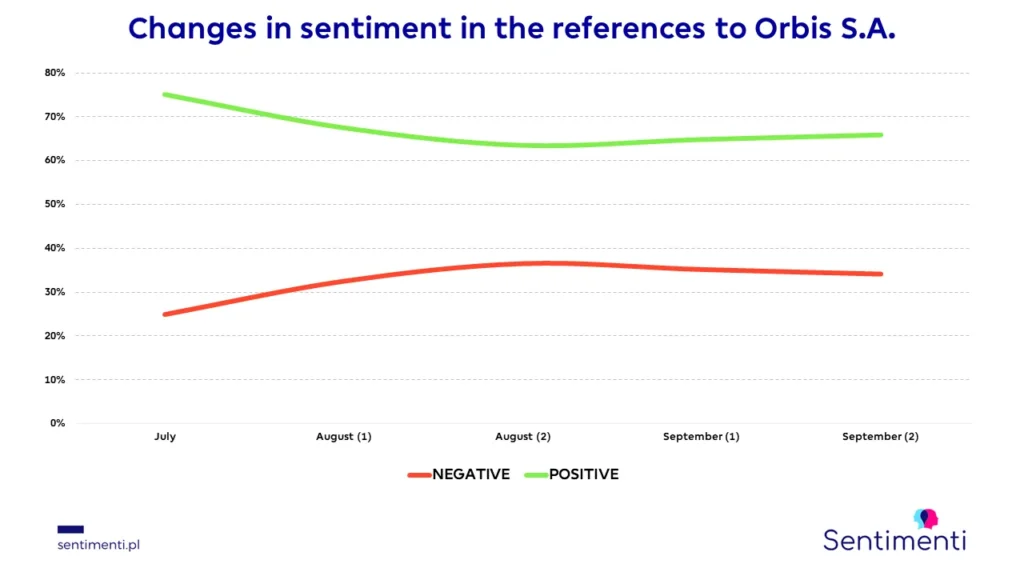
Stopping with this simple analysis will not necessarily answer the question of which emotions caused the positive sentiment to adopt a downward trend. However, using the SentiTools to analyse the entries about Orbis, we can check the emotions contained in the notes, comments, mentions, etc. from that period.
Monitoring of emotional intensity allows us to predict the crisis
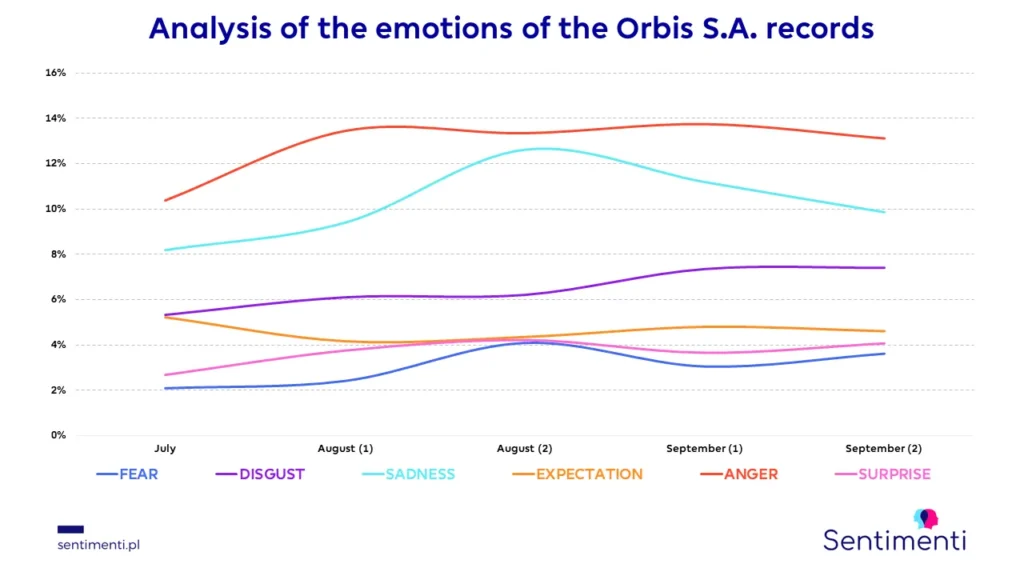
It is clear that in the time lapse between July and August the intensity of emotions defined as anger, sadness and repulsion noted a growth. Such emotions expressed by potential customers may have a negative impact on the amount of generated revenues. It would be interesting to impose on the lines of intensity of the above emotions the dynamics of revenue growth in this period (unfortunately, such detailed data are only held by the company). Without this solid information, in our analysis we can only relate it to a measurable indicator which was the share price of ORBIS S.A. on the Stock Exchange.
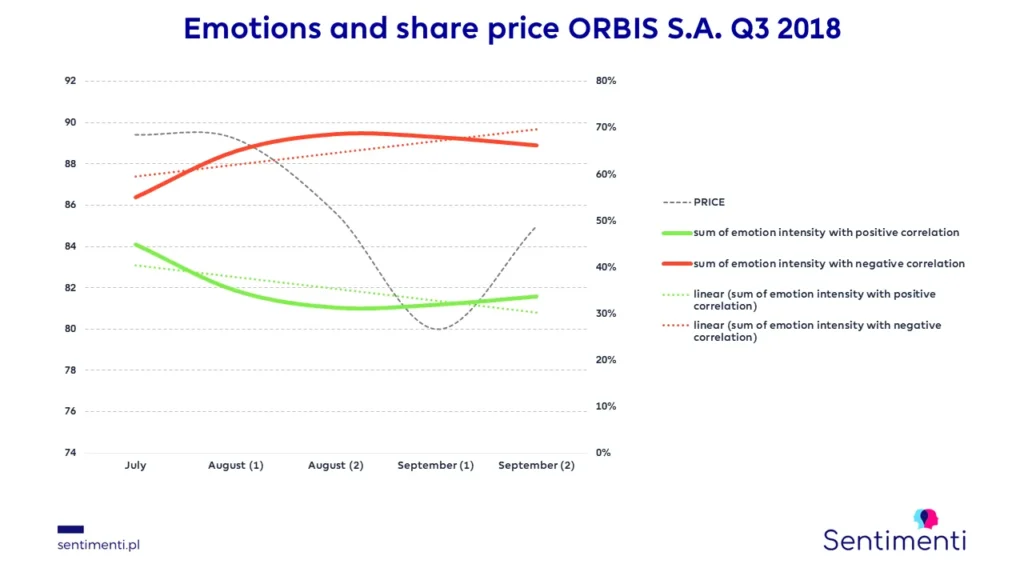
The chart above clearly shows that the emotion intensity peak with a negative correlation to the share price appeared at the end of August and preceded the jumping drop in the price of ORBIS S.A. shares. Interestingly, in total, the intensity of emotions with a negative correlation to the share price was determined by the previously mentioned emotions of disgust, sadness and anger, which recorded values of correlation coefficients of -0.82; -0.61; -0.59 respectively.
The following scale of correlation is usually assumed in statistical analysis:
- 0.5 <= rxy < 0.7 correlation high
- 0.7 <= rxy < 0.9 correlation very high
Emotions and stock market analysis
Thus, with a high degree of probability, in this case the emotions of disgust, sadness and anger expressed in the mentions of the company had a fundamental (apart from economic reasons) influence on the company’s course on the WSE. Further to that, by setting the trend lines for the intensity of emotions, it could be assumed that the process of the ORBIS S.A. share price decrease after a short adjustment at the end of September should take a downward vector. What actually took place. The culmination of the fall took place after the company published its financial results for Q3 2018.