With the arrival of January, another year of our Senti-Bot adventure in the cryptocurrency market began. We are excited to share with you the results of our tool, which achieved more than 6 times the net profit of the HODL strategy in the first month of this year.
Table of Contents
Senti-Bot results
As before, we’d like to share with you an analysis of Senti-Bot’s performance on the Bitcoin market compared to other tools available on the market, and compared to a traditional herding strategy. We present the gross results, i.e. those that do not include the Binance exchange’s commission costs, so that you can compare exactly how our bot performs compared to other solutions.
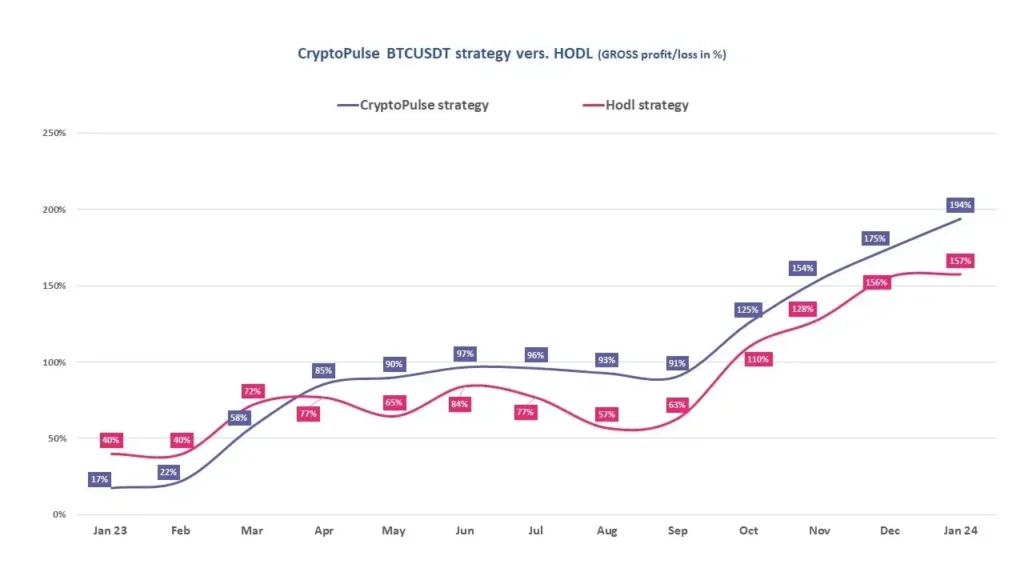
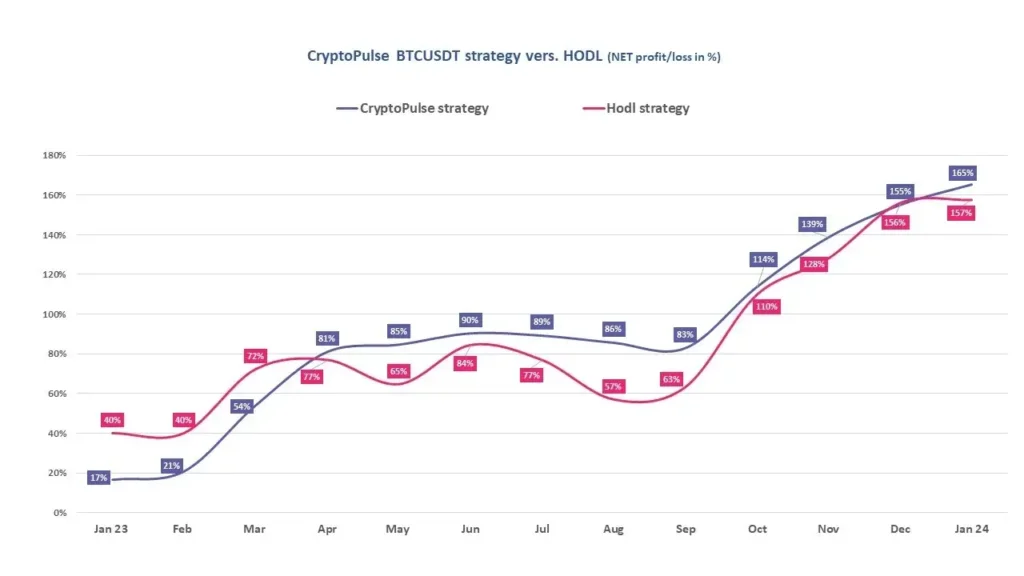
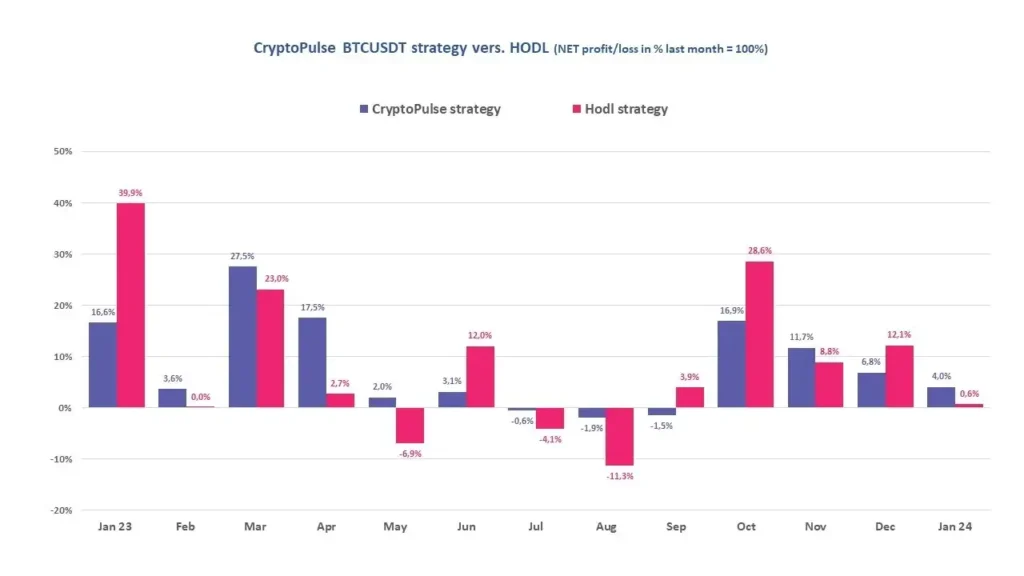
In January, we reported a gross profit of 7.3%, that is, before transaction costs. After deducting these costs, Senti-Bot’s net gain was 4.0%, compared to Bitcoin’s gain of just 0.6% during this period.
In January, we saw drastic changes in the Bitcoin exchange rate, as we can see in the chart below. These rapid emotional fluctuations of investors resulted in more transactions than your bot made. This, in turn, was associated with higher transaction costs, which reduced the net result.

Source: Stooq
Throughout January, we noticed many days when Bitcoin’s price experienced significant declines (red). These moments were clearly noticeable and affected Senti-Bot’s performance in the market.
Senti-Bot achieves its effectiveness mainly because it usually exits a long-term position before expected declines in Bitcoin’s price. Confirmation of this approach is provided by the average values of orders that ended with a profit and a loss:
- The average profit per order is: +1.29%,
- The average loss per order is: -0.31%.
This means that our bot is effective in minimizing losses by reacting quickly to market changes.
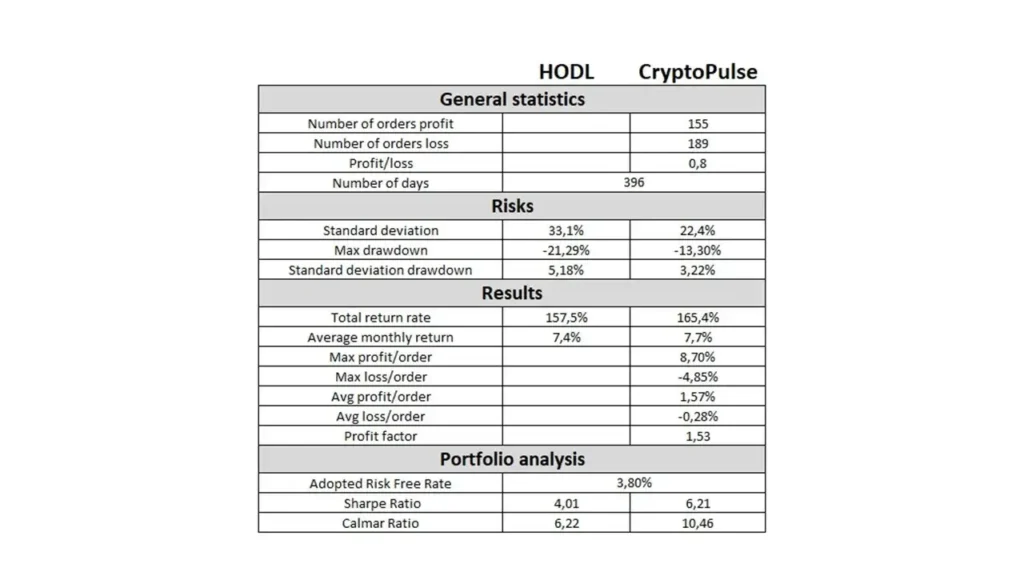
Senti-Bot performance indicators
We emphasize that the effectiveness of Senti-Bot should be considered over a period of more than one or two months.
Important elements of assessing the effectiveness of our tool are measurements of such indicators as:
- Drawdown
- Profit Factor
- Sharpe ratio
- Calmar ratio
Drawdown
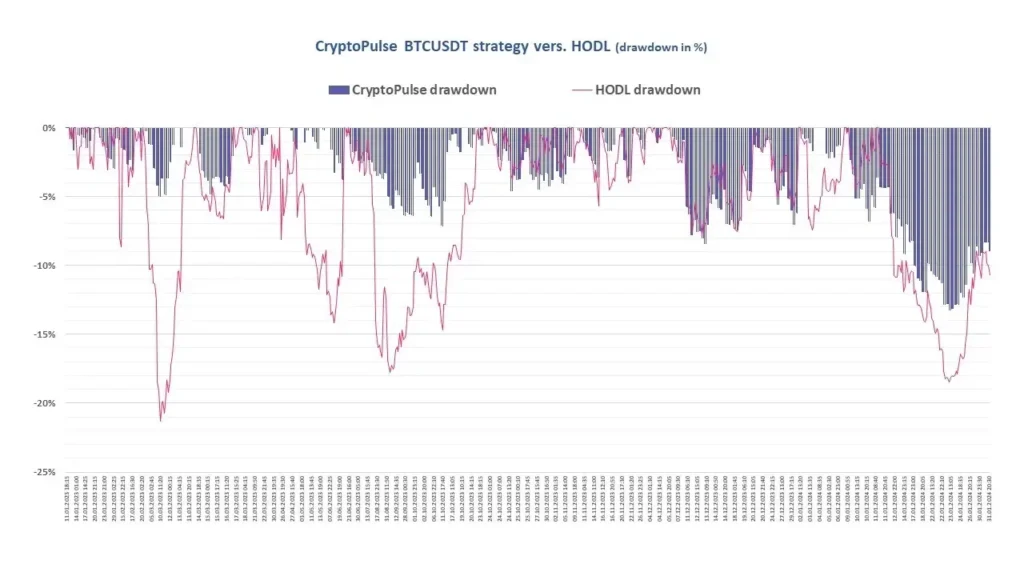
A drawdown is, simply put, the largest percentage reduction in the value of capital from its highest level. It is calculated by comparing the highest capital level to date with its current value.
The maximum drawdown (over the entire period) for the CryptoPulse BTCUSDT strategy was -13.2%, while the HODL was -21.3%.
Profit Factor
Another measure worthy of attention is the profit factor. This ratio is defined as the sum of all transactions with a profit divided by the sum of all transactions closed with a loss. A profit factor above 1.50 is considered good enough, and above 2.0 is considered ideal.
The Profit Factor for Senti-Bot was 1.53 at the end of January 2024, and we can interpret this to mean that for every transaction, the bot gained 53% more on average than it lost.
Sharpe Ratio
To assess the ratio of the return achieved to the risk taken, we track two main indicators. The first is the Sharpe ratio, which measures the risk-adjusted return (measured by average deviation). The higher the values of this indicator, the better the investment is considered. Investments for which the Sharpe Ratio is greater than 3.0 are considered among the best.
For Senti-Bot, the Sharpe Ratio at the end of January was 6.21, which means that not only was it significantly better than the breeding strategy, but it was also higher than for most mutual funds. This is important because a higher Sharpe ratio means higher returns relative to risk, which confirms the attractiveness of our investment strategy.
Calmar Ratio
Calmar Ratio is the second main indicator of investment performance, determining the ratio of the rate of return (calculated on an average annual basis) in relation to the maximum landslide. In general, the higher its value, the better. This is because it signifies by how many times the average annual cumulative rate of return exceeds the slippage to date. Values above 1 mean that the rate of return, was higher than the landslide.
At the end of January, the Calmar index for Senti-Bot reached 10.46, which was significantly higher than the landslide. This is mainly due to higher returns and lower drawdown, showing that our investment strategy is performing better with less risk.
Summary
