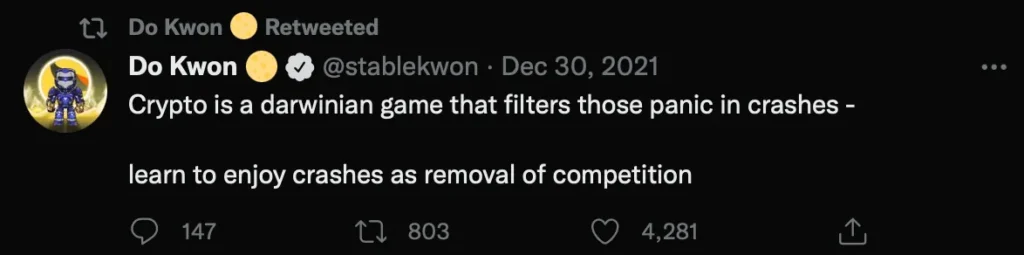
Admittedly, Do Kwon, founder of Terra Form Labs, which manages the Terra / Luna network, is not the movie’s Alexis Zorba, uttering these words, but how well that title fits here.
Project Terra emerged in 2018 and was formed by the Terra Alliance – at launch, a collaboration of 15 commerce and payments companies. Based on data from Crunchbase, the project has raised a total of $58 million from 27 investors. Including the likes of Mike Novogratz, Pantera Capital, Hashed and Michael Arrington‘s XRP Capital.
Mainnet Terra was launched on April 23, 2019. A little over 3 years later, to be precise, on May 13, 2022, the production of blocks was stopped. In this text, we want to focus on the last few days of operation of the Terra / Luna ecosystem.
At Sentimenti, we deal with emotions – their measurement and impact on decision-making. In the Sentistocks project, we use the same knowledge for financial analysis and prediction. We measured exactly what emotions the project generated in the last days before the collapse.
You’re welcome, fasten your seatbelts, we’re taking off.

Number of mentions
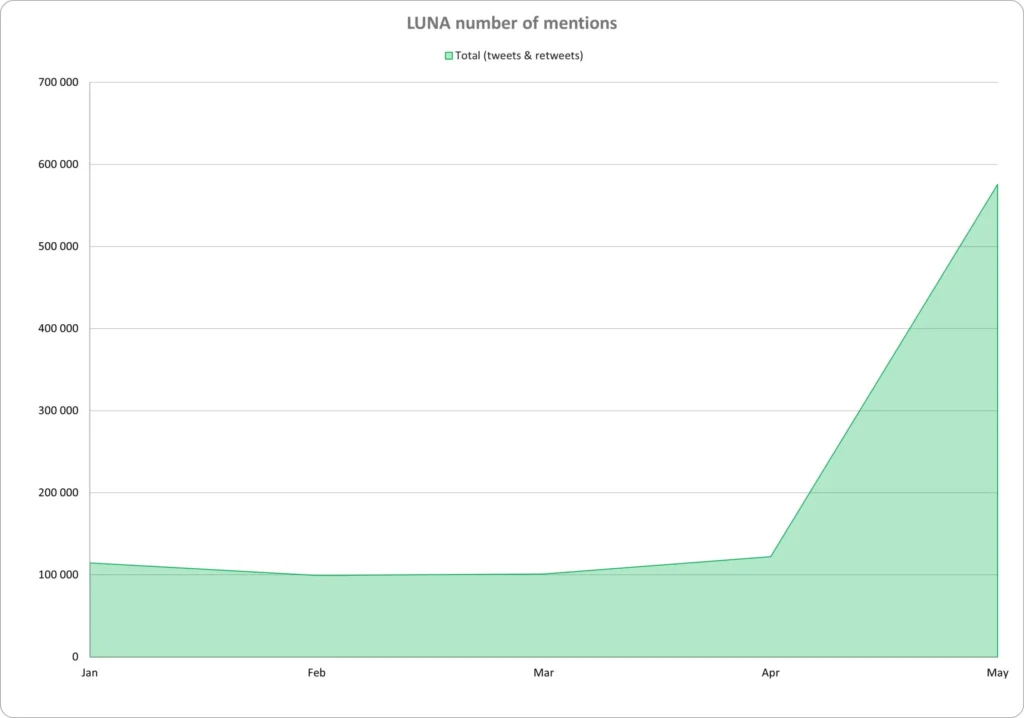
The first we collected mentions since the beginning of the year. This totaled over 1,100,000 sources, centered around keywords such as luna, terra, ust, Do Kwon or Terra Money.
It was overwhelmingly Twitter, with over 1 million mentions. We found 70,000 mentions on various thematic portals, about 12,000 on forums, almost 5,000 on various blogs.
Surprisingly, during the analyzed period (January to April), the average number of mentions fluctuated around 100 thousand per month. However, in the first twelve days of May, the number of collected information on Terra / Luna, reached 600 thousand. This is practically a 12-fold increase in interest, compared to other, “normal” periods.
Terra Luna price. From quantity to quality
Now let’s look at the qualitative data. How did the market react, do we find a correlation between the number of mentions, LUNA price and sentiment? Or maybe the Fear&Greed Index (or more precisely, CFGI – Crypto Fear&Greed Index) is a more helpful analytical tool?
Finally, we will analyze the same period through the lens of individual emotions.
Sentiment in May, day by day
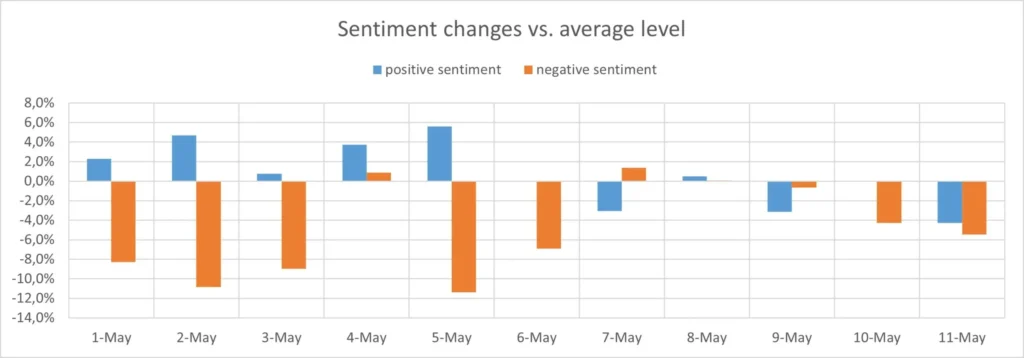
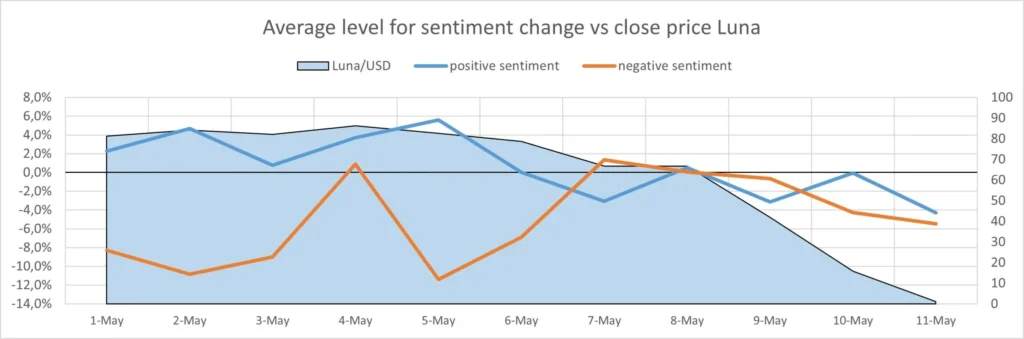
We don’t know about you, but I don’t see any particular correlation of the price to sentiment. On May 8, we even saw an increase in positive sentiment. Negative sentiment, on the other hand, was generally rising, but it also never exceeded the average value for May. Nothing alarming, you might say. The iceberg is cutting into the Titanic’s hull and the orchestra is playing a waltz.
Sentiment is unfortunately too imprecise a tool. Read more about it on our blog.
Maybe…
Maybe Fear&Greed can help?
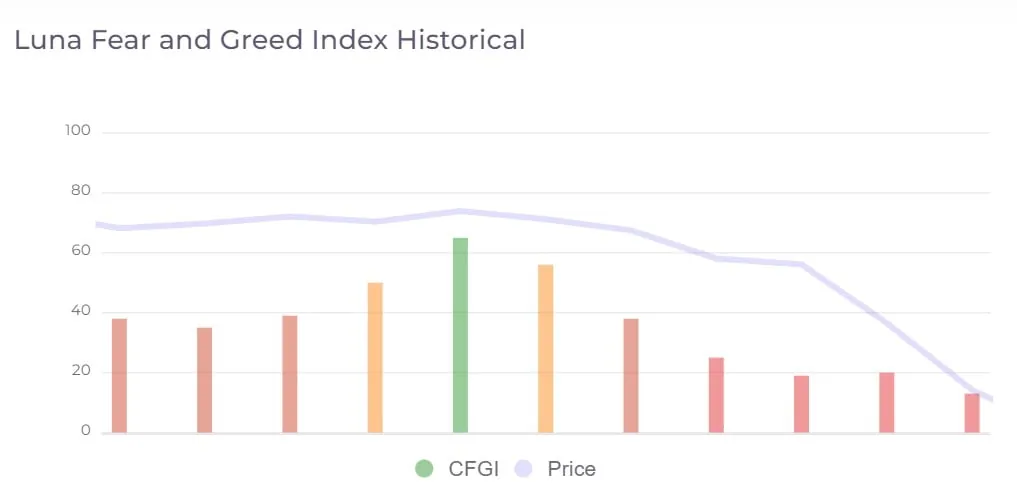
The image above is from cfgi.io and refers to the LUNA for the period May 1-11, 2022. We don’t fully understand the methodology behind this index. Let’s look at the period from May 3 to May 6 – the index rises and the price in fact remains unchanged. Similarly, May 9 and 10 – the index gently up with a dramatic drop in the LUNA price.
It is hard for us to imagine this tool to be used as a predictor of upcoming changes.
So let’s go much deeper, to the level of individual emotions
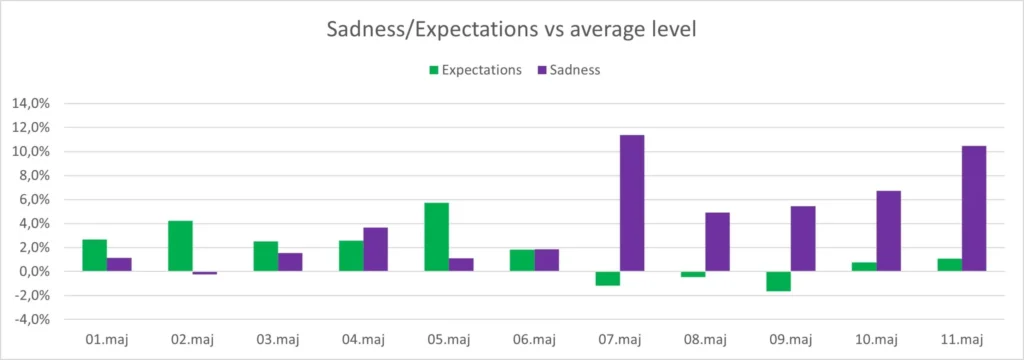
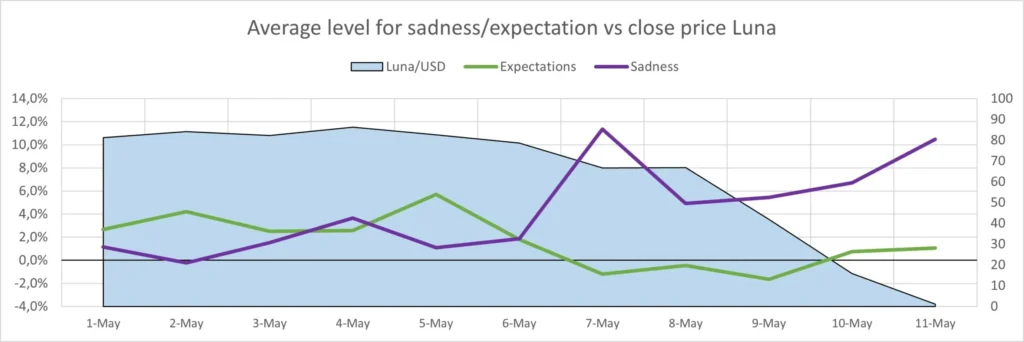
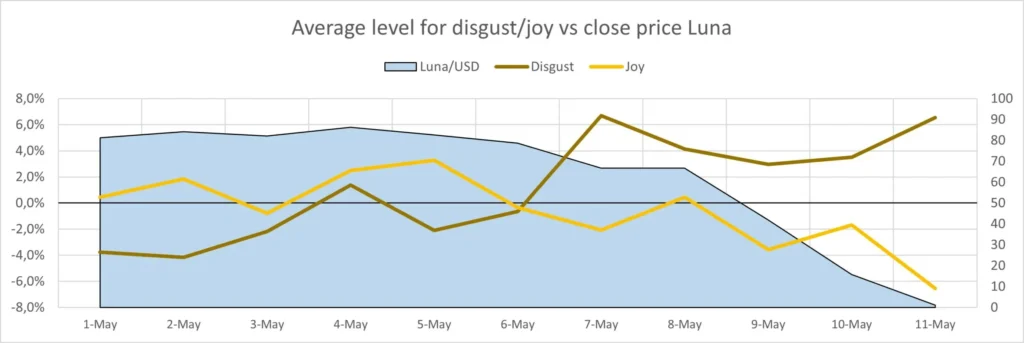
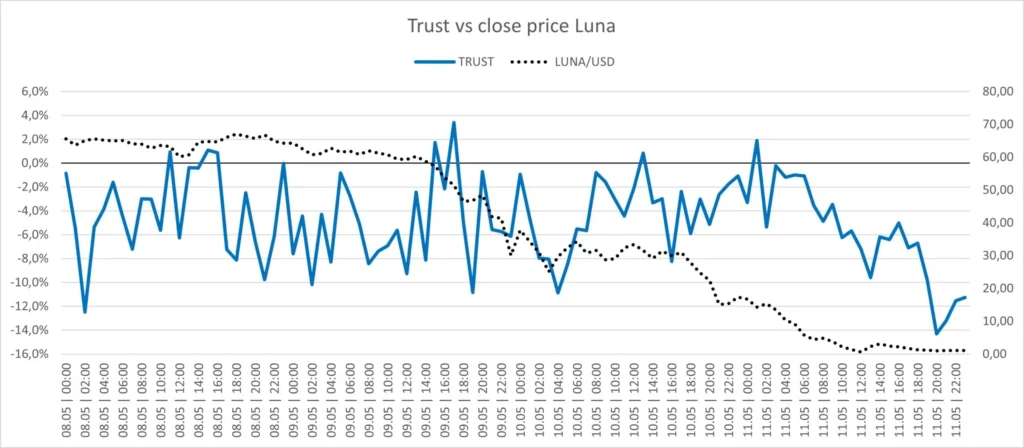
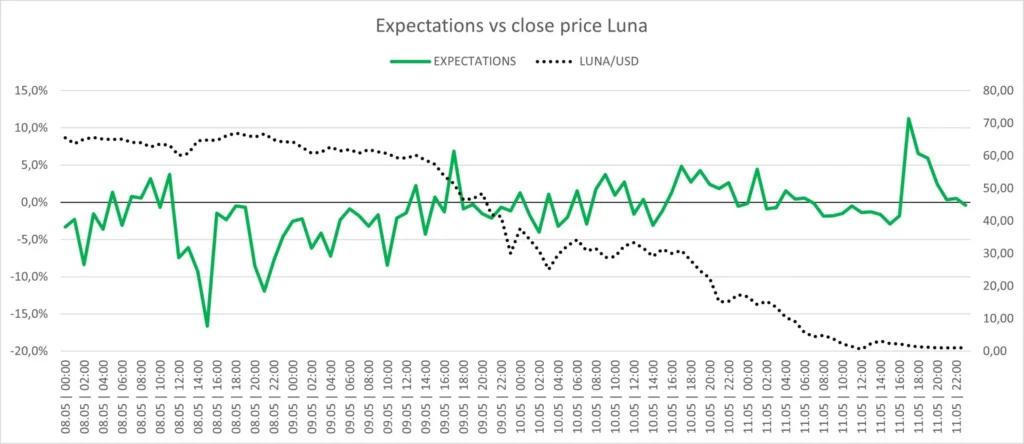
To achieve this, we put the emotions measured by Sentimenti into pairs: anger-trust, sadness-expectation and disgust-joy. The graphs show the change in emotion for each day against the calculated average for the period from 01 January to 30 April 2022. This way it shows more clearly the changes during the period under study.
For those who wish to compare the emotions with the price, we add each day’s graphs relating to the change in the close price for LUNA:

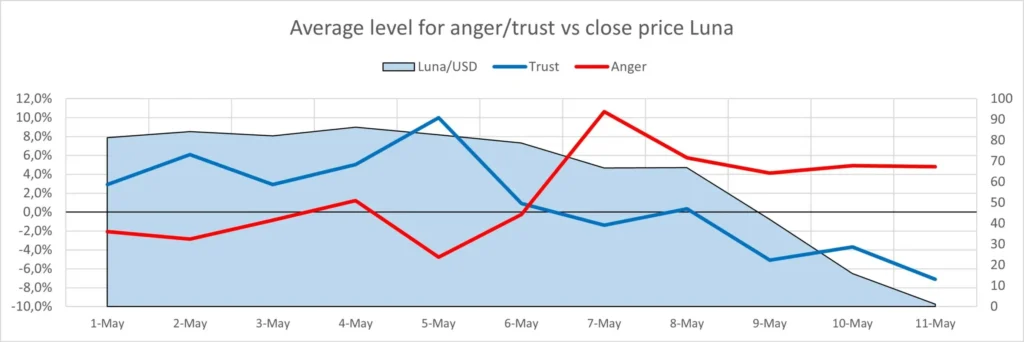

The drama of the changes seen in the graphs also lies in the fact that, at the same time, the number of recorded mentions alone increased more than tenfold (1,136 mentions on May 1 versus 12,711 mentions for May 11). So basically, in some simplification, we can assume that the change in trend for each emotion was ten times greater than that shown above.
At the same time, each emotion pair confirms the trend reversal after May 6. Interestingly, we see the greatest extremes in trust (17.1% difference decrease) and anger (15.4% increase). The value of fear (down 6.9%) and surprise (up 6.8%) changed the least. As you can see, the crypto world is hard to surprise or scare 😉


What you also see is a clear correlation between individual emotions and the LUNA rate. Not necessarily for sentiment. This doesn’t surprise us – we’ve been using such an accurate measure of emotion for years in forecasting the price of financial instruments like Bitcoin.
Even more emotions
We all know that the most important thing happened between 8 and 11 May. We have tracked this period particularly closely, hour by hour. During the peak period (12 May from 20:00 UTC+2) there were even more than 3,000 mentions per hour. Set against an average of 443 mentions per hour, you can see how more and more people were actively involved in commenting on the event.
Let’s see how the selected emotions behaved during this period:
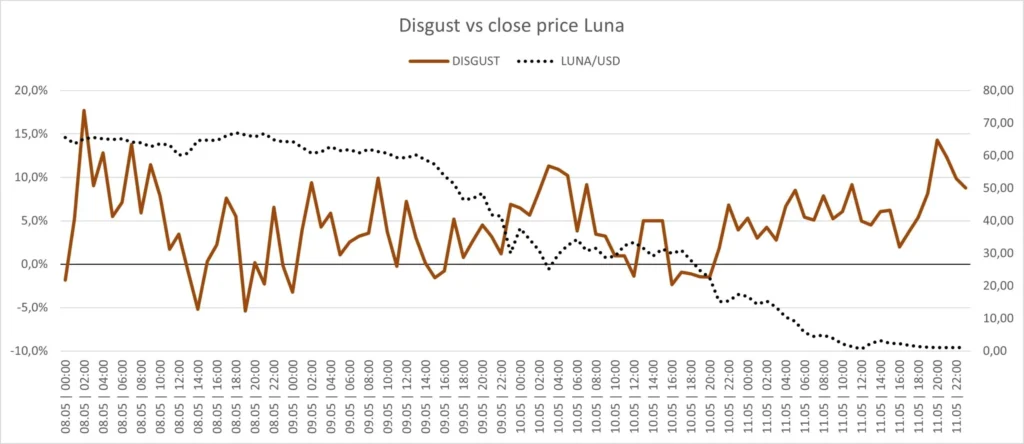
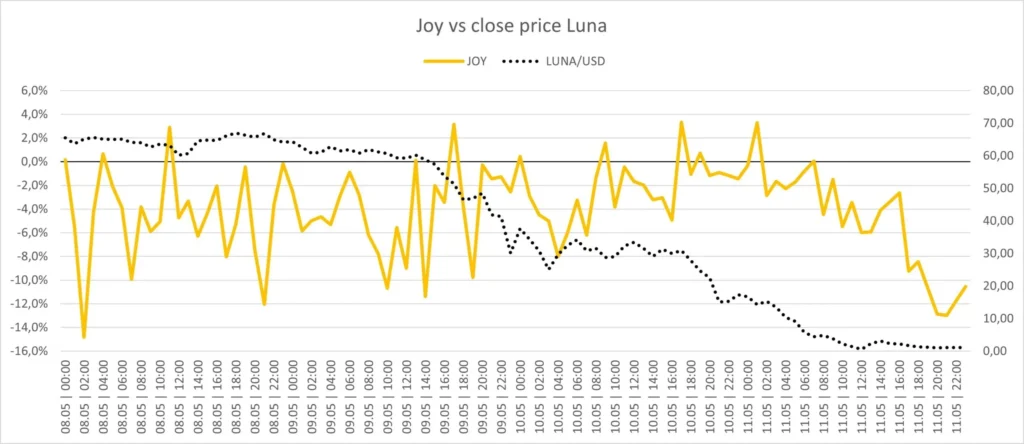
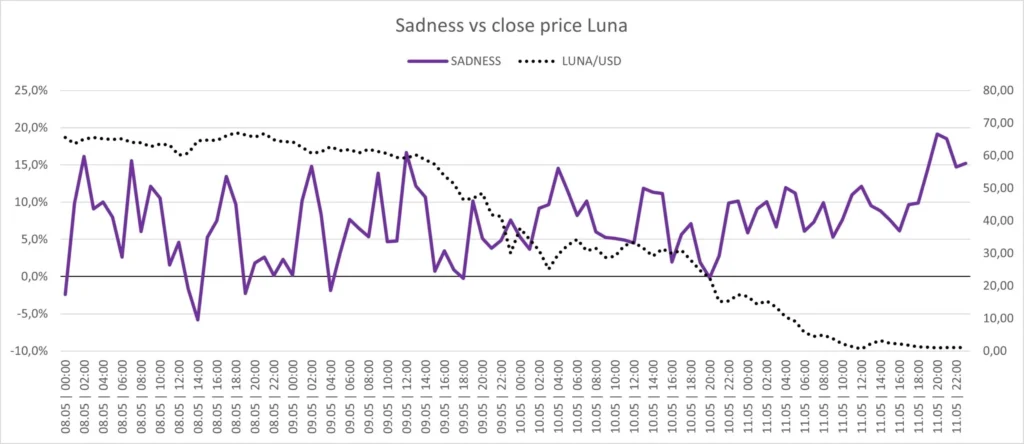
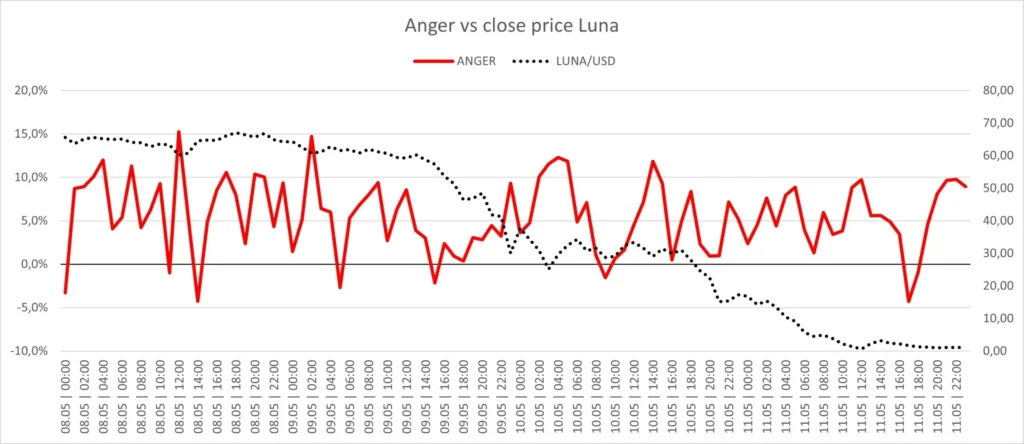

A glance at the behavior of each emotion relative to the baseline mean (0% on the X axis): all negative emotions are above the baseline mean with an increasing trend. Positive emotions, on the contrary, are below the baseline average with a declining trend.
For the analyst, these signals should be unambiguous that something bad is going on with the project if hour after hour the values of the emotions start deviating from their averages.
As a conclusion
Never focus on single words, statements, single people. Look more broadly at what emotions are currently present in the market. Not sentiment, not the Fear & Greed Index. The individual emotions and their context.
Have knowledge and be right before the fact, not after. The most important thing is to make your own decisions, according to your conscience. Sentimenti helps to verify them, but remember to do your own research.